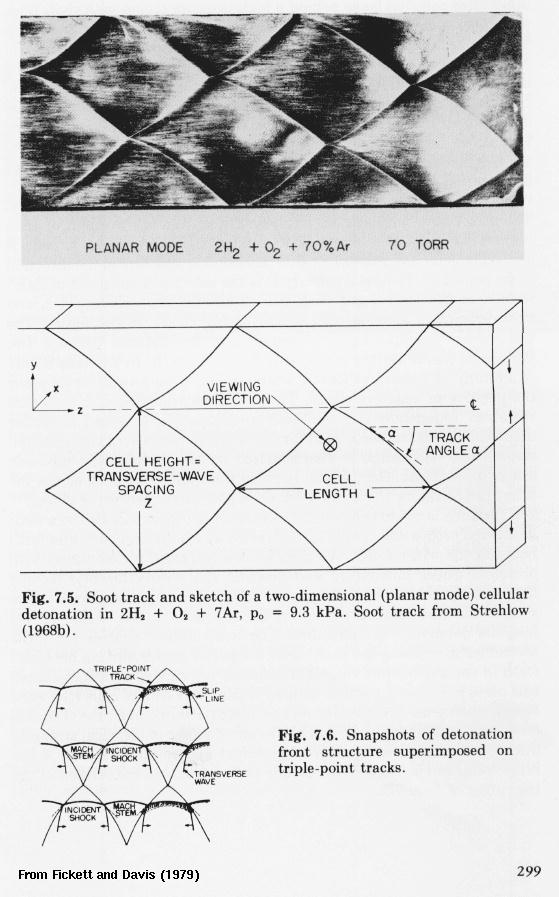
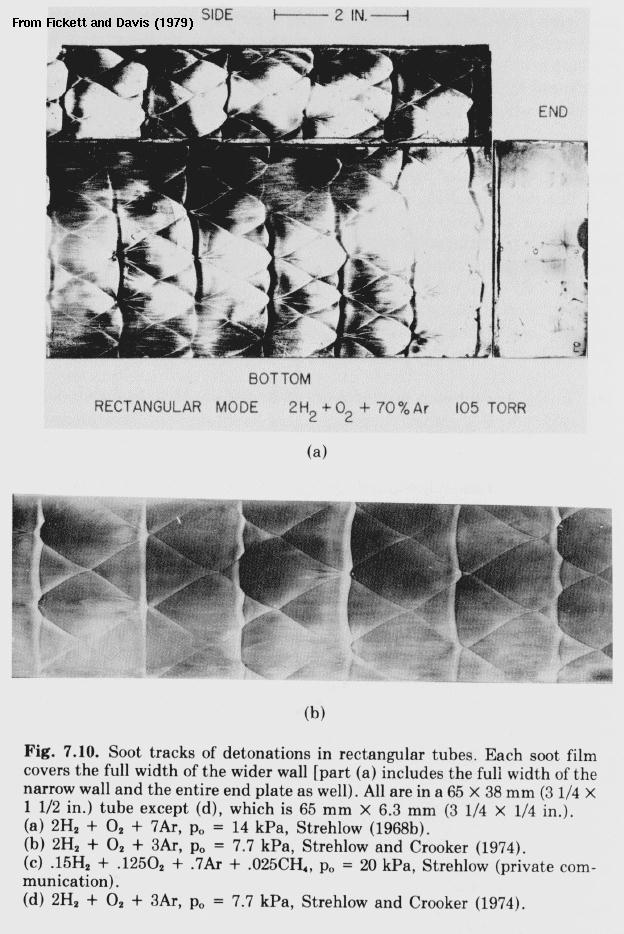

Some experimental smoked foils. The pictures were scanned from Fickett and Davis (1979). The experiments were performed by Strehlow (1969) which is where Fickett and Davis also obtained the pictures.

Some experimental smoked foils. The pictures were scanned from Fickett and Davis (1979). The experiments were performed by Strehlow (1969) which is where Fickett and Davis also obtained the pictures.
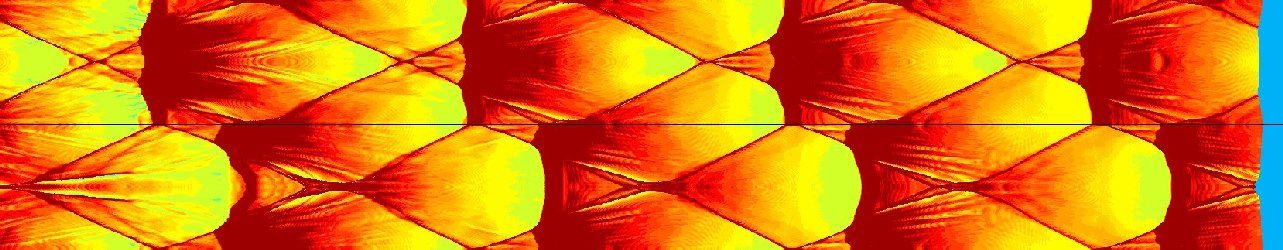
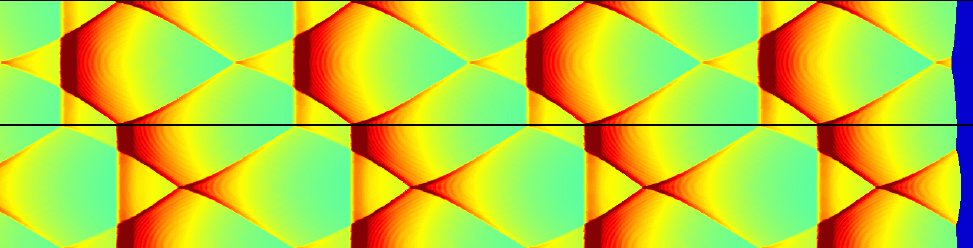
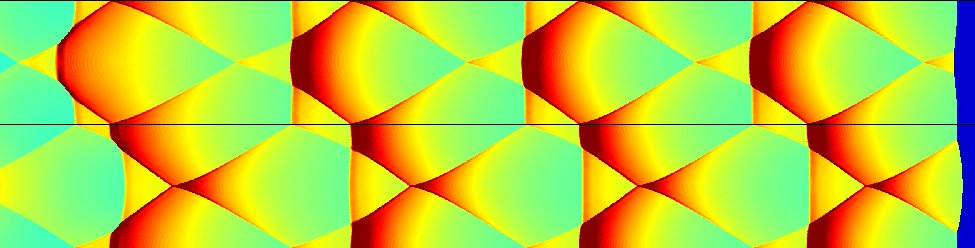
Fortunately, we can easily generate the same "smoked-foil" effect numerically. All this requires is to track the leading shock position and pressure as a function of time. Then we just plot this on a two-dimensional grid to give the results below.
This case has fairly periodic cell structure The detonation starts out at the left hand side of the top picture, and propagates to the right. The second and third pictures are a direct continuation of the first. Out of the five complete cells in this series, the initial perturbation has the most effect on the first two. It finally merges with the main transverse waves about two thirds of the way through the second cell. By the third cell in the series, the detonation seems to be in its final state.
Overdrive 1.2, Activation Energy 10, Heat Release 50, Gamma 1.2
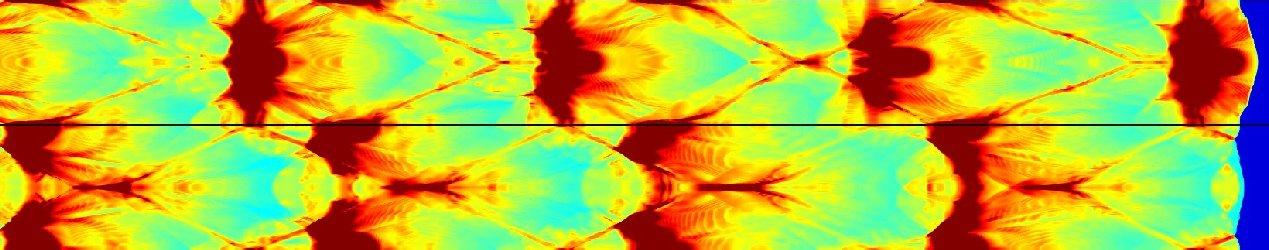
The following two pictures were generated for the same dimensionless paramaters as used in the two dimensional cases above. Two grid resolution were used, 16 and 32 mesh points per ZND half-reaction length. The major difference to note in the following numerical smoke foils is the presence of the slapping wave.
Overdrive 1.1, Activation Energy 20, Heat Release 2, Gamma 1.2
16 mesh points per ZND half-reaction length (170x80x80)
32 mesh points per ZND half-reaction length (340x160x160)
Overdrive 1.2, Activation Energy 10, Heat Release 50, Gamma 1.2
16 mesh points per ZND half-reaction length (170x80x80)
32 mesh points per ZND half-reaction length (340x160x160)